
Automatisation in Risk Management has long been a necessity - risks in online business keep growing immensely, while manual data processing is unable to guarantee effective protection from online fraud. Outdated technological approach may do harm to both - online business finances and reputation.
We are really proud to announce our new product - automatic risk management reporting and benchmarking. This product will allow experts to compare fraud risk indicators with aggregated data from other companies in the same region as well as to receive very clear feedback and guidelines to improve decision-making system and application flow segmentation setup.
This product also enables risk experts to assess risks and benchmark traffic based on our cutting-edge methodology and to gain insights into company's current problem points. New product is available to all our clients in their personal accounts.
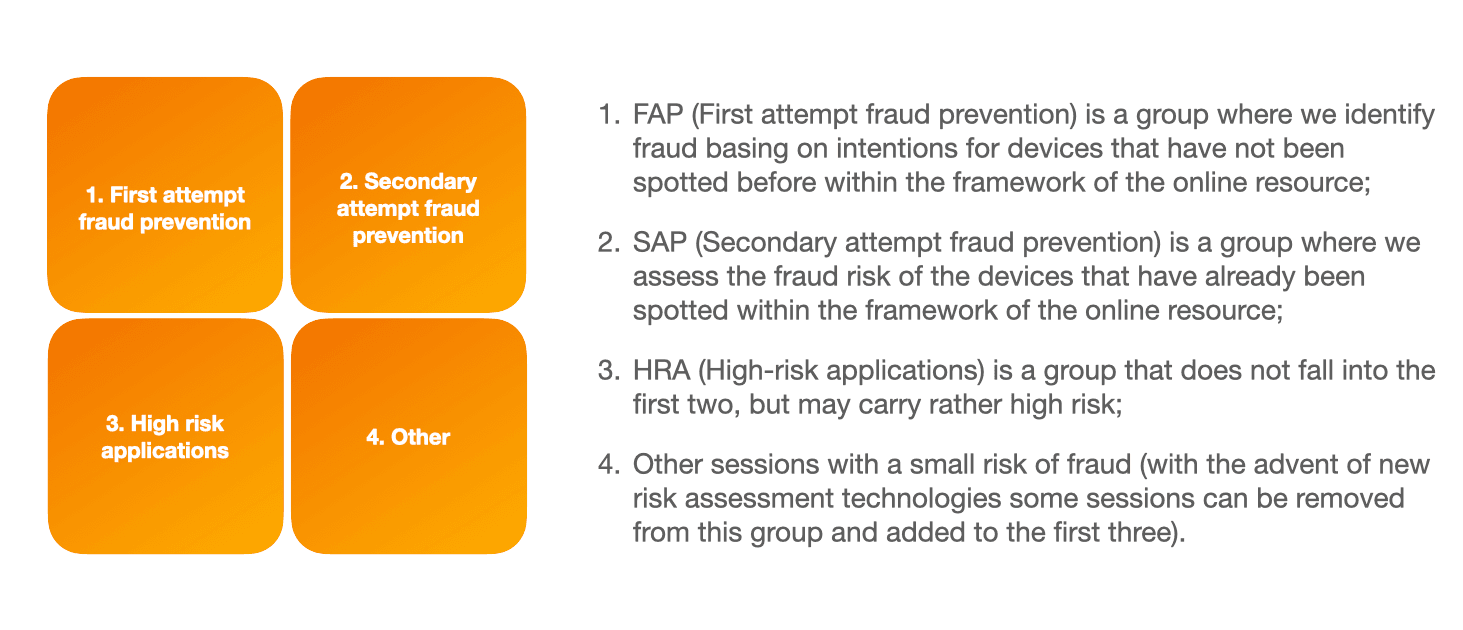
Our approach is based on the group of certain metrics - First Attempt Fraud, Secondary Attempt Fraud and High Risk Applications - all together they form full group of events in terms of risk categories and risky applications with a regional breakdown. On applying this methodology it's easy to conduct segmentation on the whole application flow and highlight risk zones.
Practical application of the product
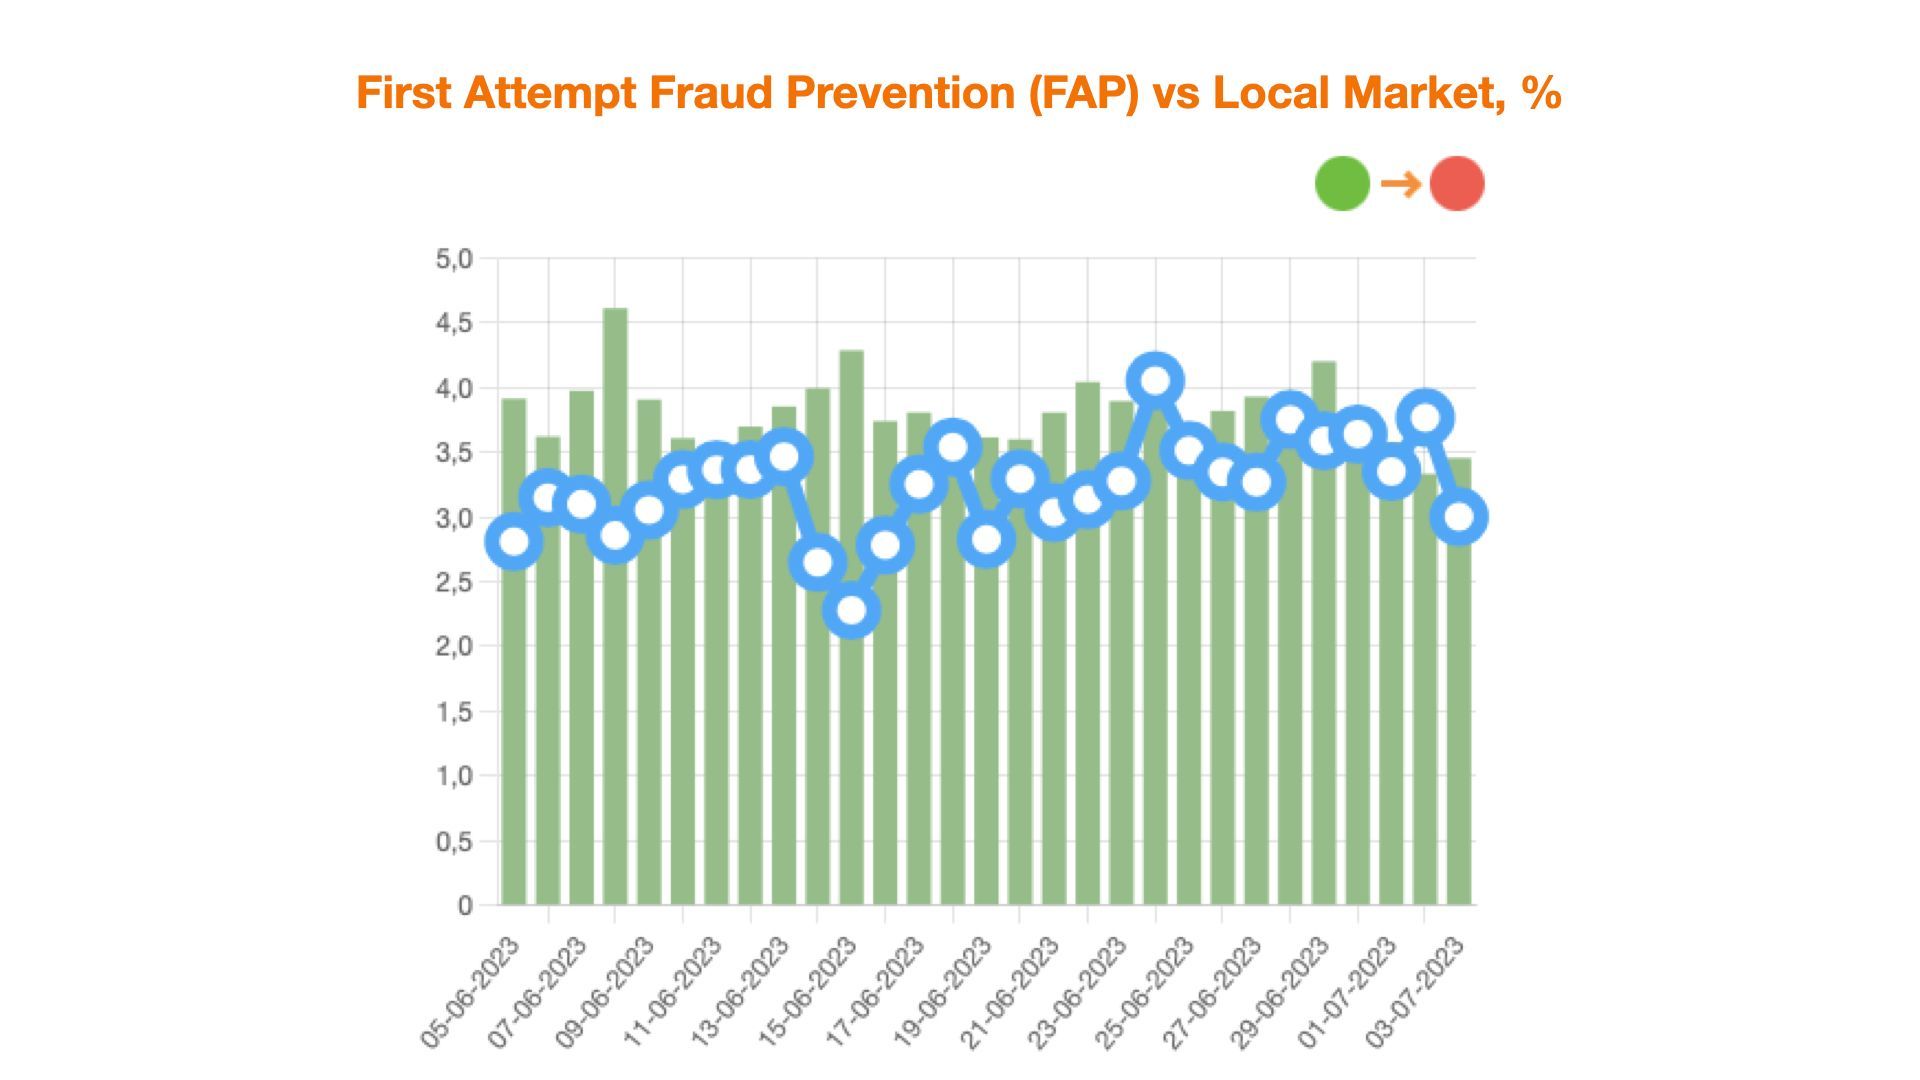
First Attempt Fraud prevention category indicates the level of traffic “toxicity”, flowing to credit organization online resource including technological fraud, network anomalies and other high risk markers. If this indicator is above the market average for your segment, it means that your current anti-fraud policy has a significant potential to grow.
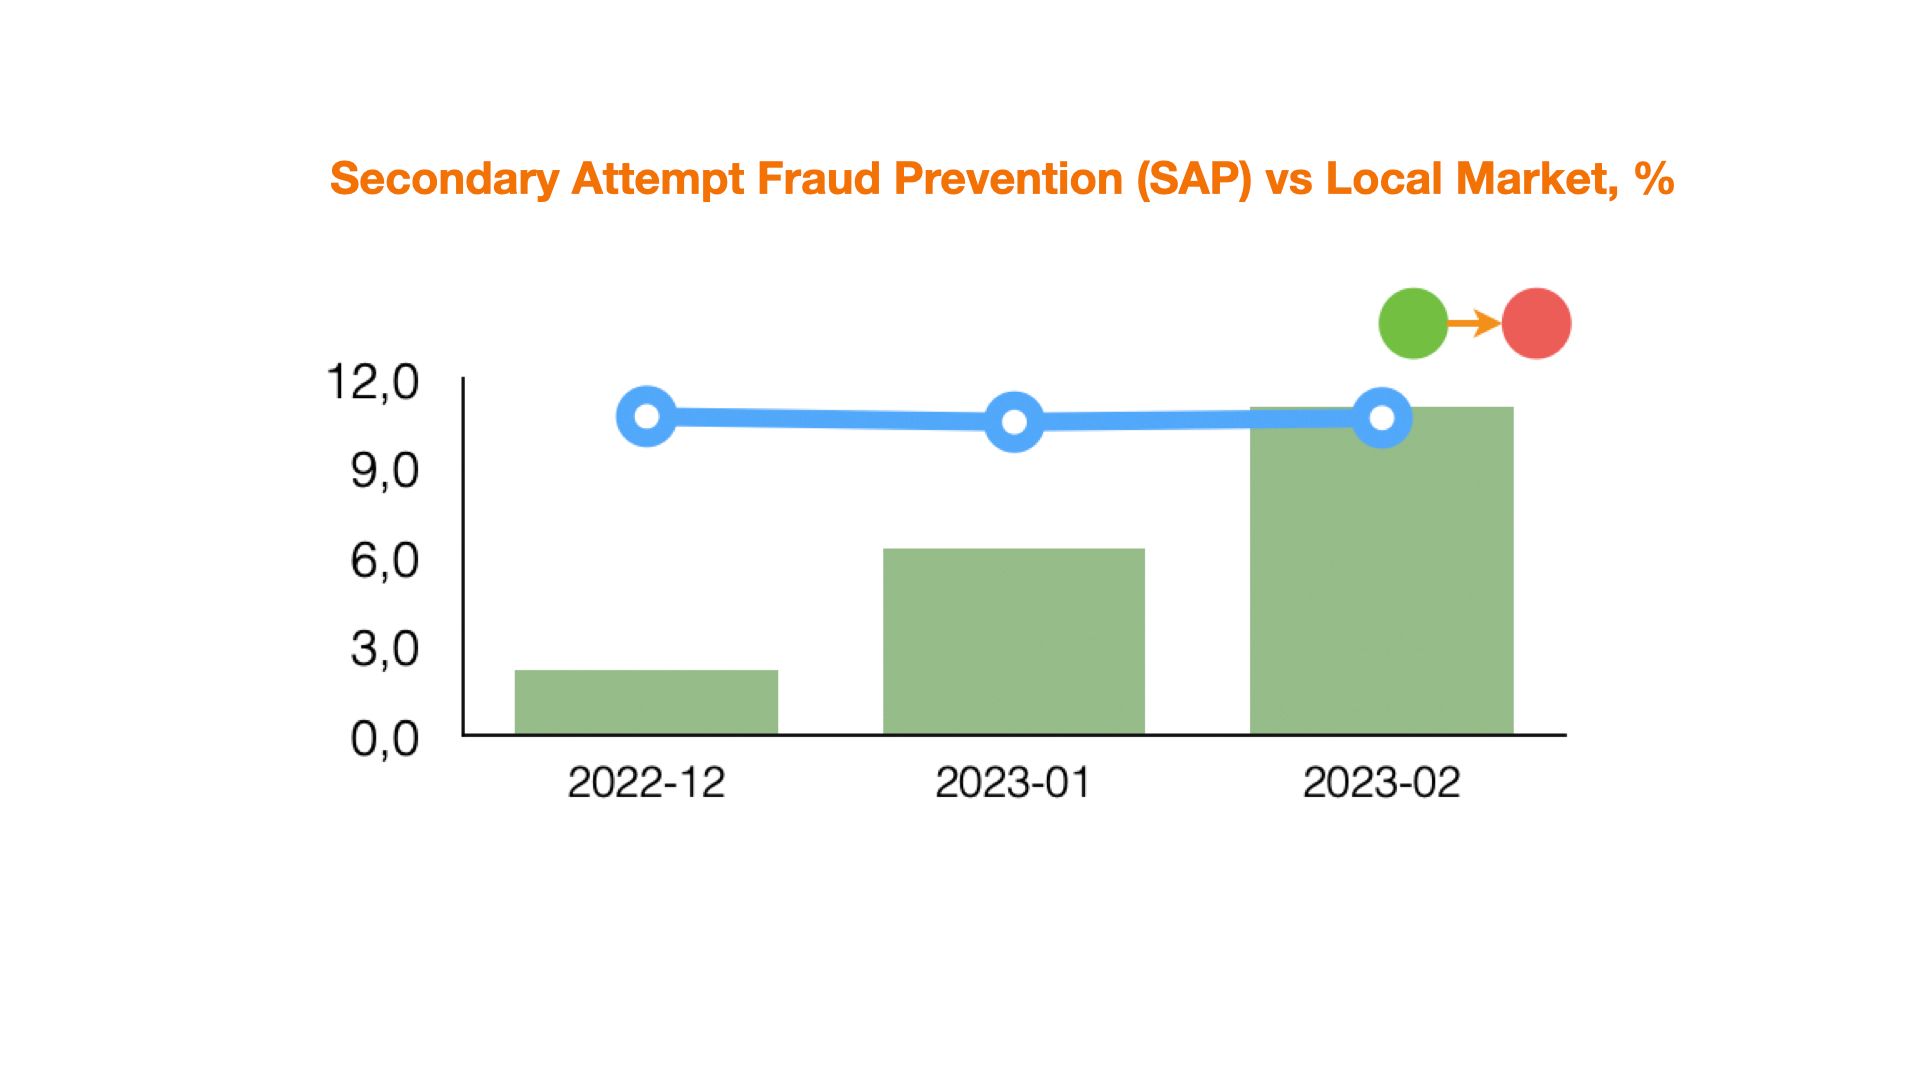
Secondary Attempt Fraud Prevention category indicates the proportion of repeated devices in application flow, i.e. those devices, which have been spotted previously on the creditor's resource and no special tools for device fingerprint distortion have been used. If Secondary Attempt Fraud metrics are higher than market average, it means that the company should use anti-fraud technologies at the device authentication level (in particular, repeated devices parameters) in more effective way. In order to handle such traffic, it's worth using various verification tools related to alternative data sources. In combination with other markers of JuicyScore response vector, for example, consistency of application data checks, confirming that the application data belongs to this particular user etc. you can work with such traffic easily and effectively.
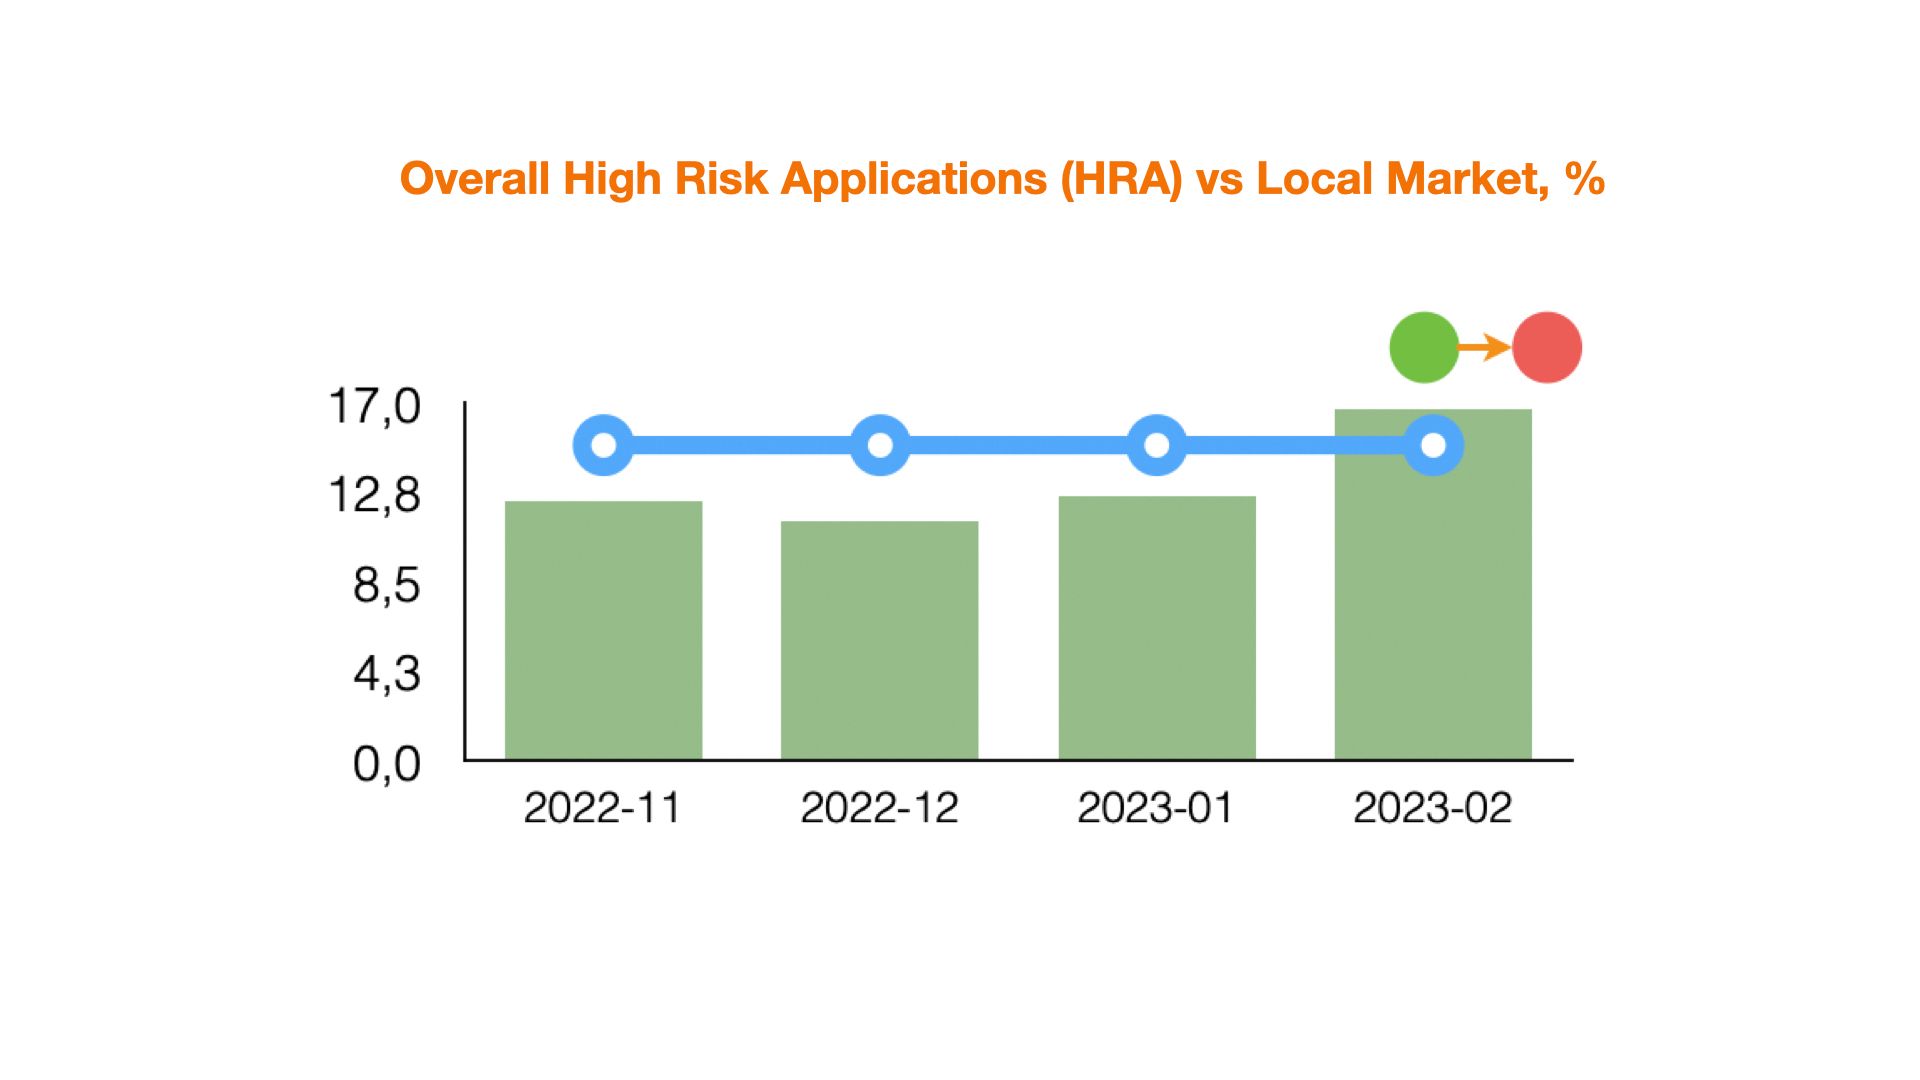
High Risk Applications category in most cases is the most extensive one in terms of the number of observable parameters and share over the traffic flow. If HRA metrics in the IDX5 section are 10% or more lower than market average, it means that the initial traffic is of lower quality in the context of disposable income. Device quality correlates quite strongly with disposable income indicator. You should pay attention to those methods of traffic filtering and sources of its generation in order to improve the situation in comparison with competitors.
This group also includes risk markers of various nature, so the most effective tool is to build a scoring model, including JuicyScore data with further cutoff levels determination, applicable actions and additional data sources. As an alternative solution a creditor may arrange sets of rules and filters in order to highlight high-risk areas. You also can use this information at the stage of traffic sources selection.
More data - Better Analytics
You can discover more details in terms of risk markers and various parameters in product's paid mode.
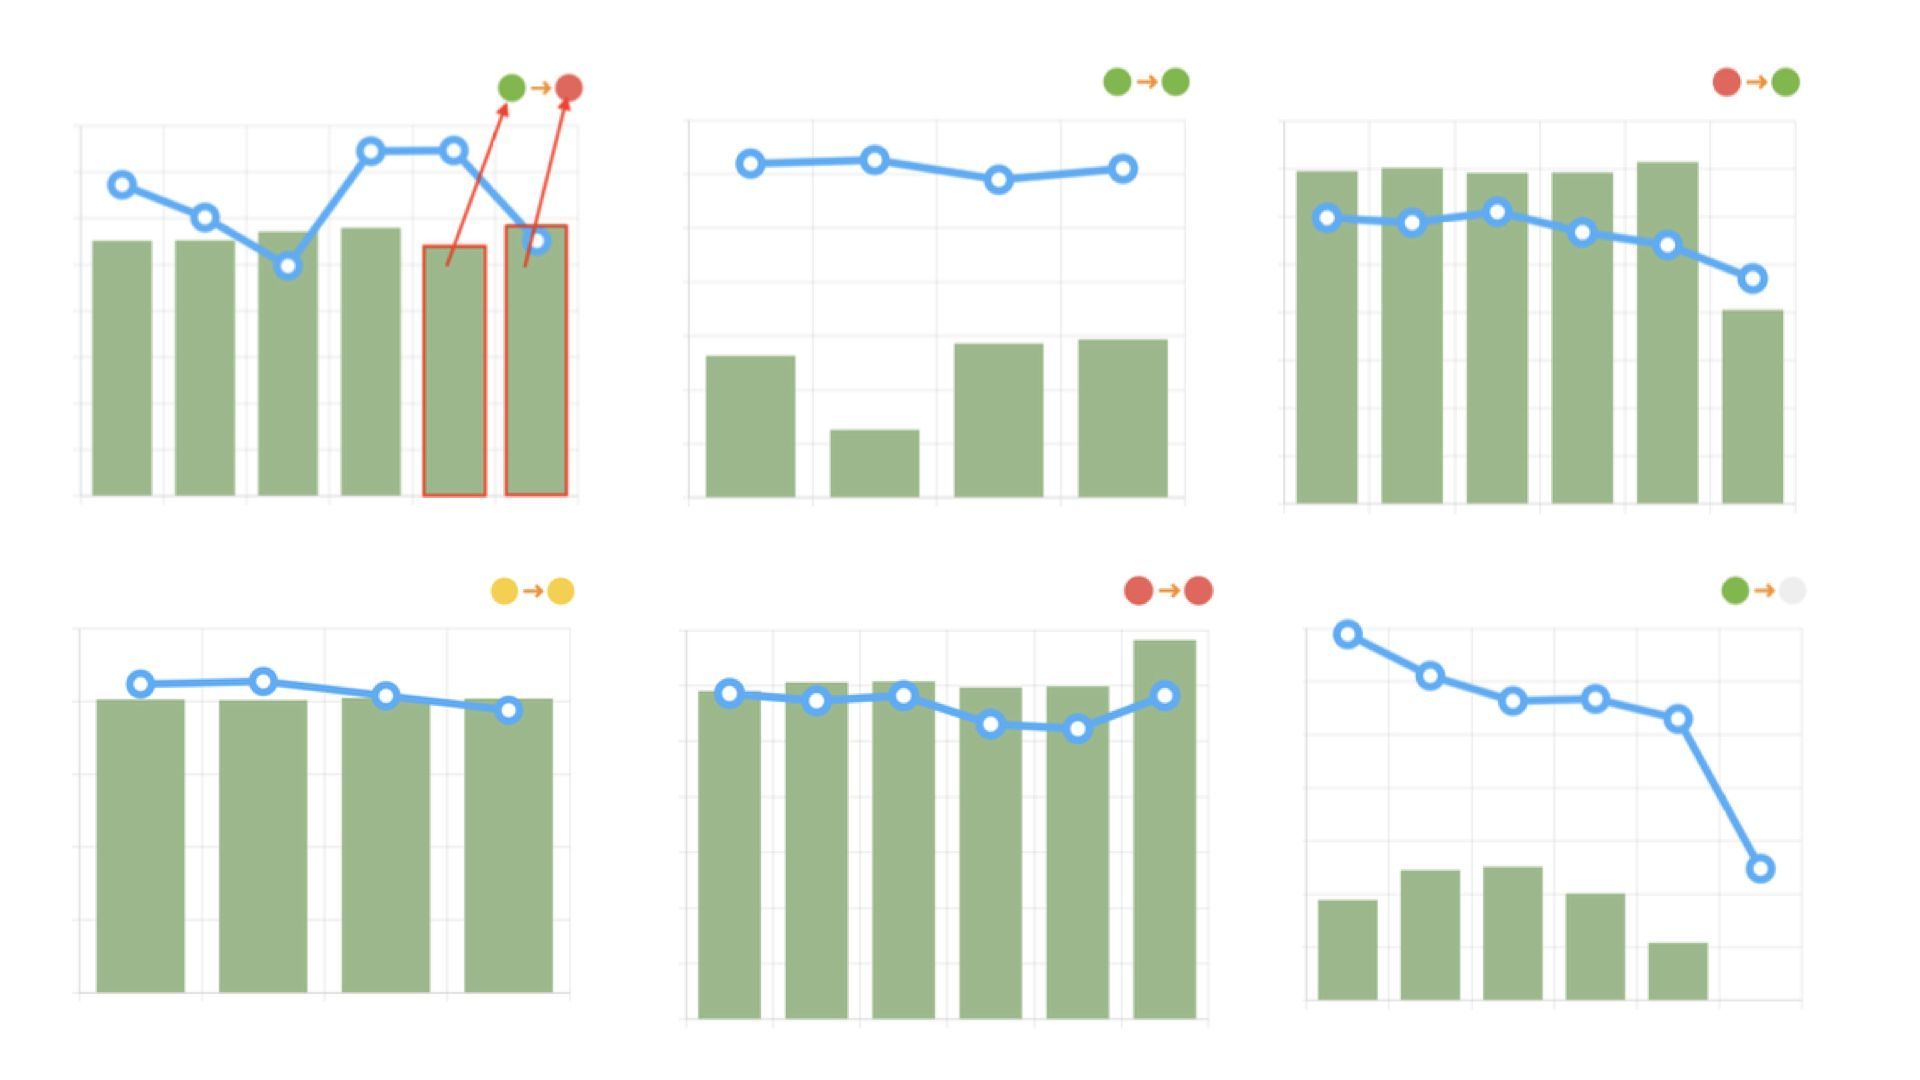
All graphs are provided with a color code system, the colors reflect the current situation based on the last two columns.
- Green light turning into red means negative dynamics, deterioration of the situation (it is worth paying attention to the possible causes of its occurrence);
- Green light turning into green means that current situation is steadily better than market average;
- Red light turning into green means positive dynamics, situation is improving (continue to monitor the situation);
- Yellow color turning into yellow - steadily near the market level;
- In case both lights are red, the situation is consistently worse than the market average (you need to refer to recommendations);
- Any light turning into grey means that there is not enough data in order to analyse specified period.
JuicyScore methodology fundamentals
The key positive factor of this approach is that all the high-risk sessions inevitably fall into one of the four groups, therefore, we can spot 100% of all possible online fraud attempts. Another advantage is that this approach does not depend on the country, technologies, local legislation etc., which means that one can compare various online resources and countries.
The key difficulty lies in the risk assessment itself, i.e. in finding suitable variables/markers/behavioral signs that would characterize the risk for a particular session and would allow it to be assigned to one of the groups, as well as the variety of available data and tools. The solution to this problem lies in the construction and design of a scoring system to counteract fraud.
You can learn more about our methods here.
Naturally, in antifraud and risk management there is no single and universal approach that would solve any problem and give 100 percent result - every expert is in constant search of a balance between data value and a stable approach. However, with our new product, we will significantly simplify the internal risk assessment procedures in most companies: with the help of automation, you can be one step ahead of other companies that have not yet fully realized the need to move to automation.
JuicyTeam always provides its customers with access to the best tools, we keep our researches in 30 countries and dozens of companies, so we are confident that new methods and tools for automating risk management will help to reduce risks in online business significantly and improve the quality of decision making.