
In May 18 we presented a new version of API v10, where more than 200 predictors and improved score model are now available to our clients. Com-paring to the previous v9 release more than 30 completely new predictors were added. One of the most important add-ons was the launch of new index variables, specially developed by machine learning methods. Empowered by significant prediction ability, they show certain charac-teristics of a device, Internet connection, as well as a number of other metrics and are ready for use in the client’s credit conveyor.
The essence of risk mangament issue
Risk management role is to collect and deeply analyze all available data about the borrower to achieve the maximum decrease in write-offs on the application inflow and in the client portfolio. If the grouping of data is right, it will allow to identify and strengthen trends and increase the predictive power of a line as a result.
Today we are going to introduce first test results of five new API v10 predictors.
StopMarkers - IDX1
The variable that aggregates more than 20 different stop-markers (TOR, cookies copying, User Agent issues, etc.), which are usually rare (less than 1%) events, but with a high probability of write-offs.
On the charts below the histograms show the distribution of the population between IDX1 values (orange and purple for POS bank and microlenders respectively), and lines for the relative bad rate to the average.
Chart 1: IDX1 distribution by population buckets and the relative bad rate indicatorIDX1 = 0 means “no stop markers” found; if IDX1 = 1, we recommend using enhanced verification for such applications. When IDX1 ≥ 2 concentration of fraud-risky applicants is high and application reject without additional checks is most appropriate decision.
User Behaviour Markers - IDX2
This variable collects behavior markers
of the device user. The risk level depends on anomalies re-lated to such factors as the application fulfilment speed, the number of corrections, etc.
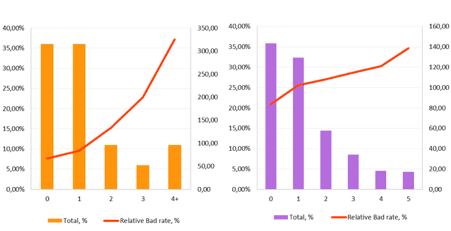
Chart 2: IDX2 distribution by population buckets and the relative bad rate indicatorIDX2 values range from 0 to 3 can be used as an additional parameter in the lender’s integral score model. Applicants with a high risk of fraud are marked in IDX2 ≥ 4, where application reject is most appropriate decision.
Device Markers - IDX3
The variable is built on secondary risk factors associated with the device from which the application is fulfilled. Suspicious user behavior is associated with anomalies on the device hardware, as well as specific settings of its software.
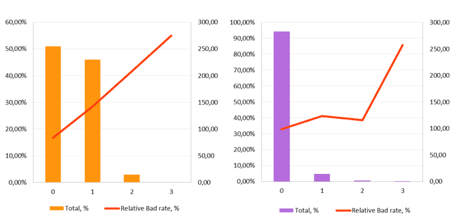
Chart 3: IDX3 distribution by population buckets and the relative bad rate indicatorIDX3 values equal to 0 and 1 are recommended for including into the lender’s integrated model, 2 for additional manual checks, and 3 or greater for fraud prevention rules.
Connection Markers - IDX4
The variable combines network connection of the device markers: IP address anomalies, the time zone mismatch, proxying, etc. The risk of write-off increases in proportion to the quantity and quality of revealed anomalies.
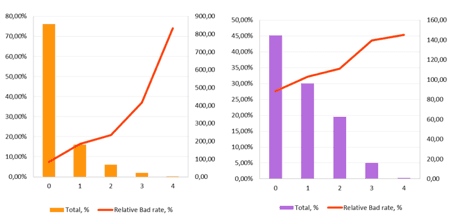
Chart 4: IDX4 distribution by population buckets and the relative bad rate indicatorThe variable shows a good monotonicity of the bad rate and may be applied to the score model for credit risk rating well. IDX4 values ≥ 4 can be used for fraud prevention rules.
Device Quality - IDX5
The variable aggregates device characteristics; it is a function of device cost and quality which cor-relate with applicant’s income.
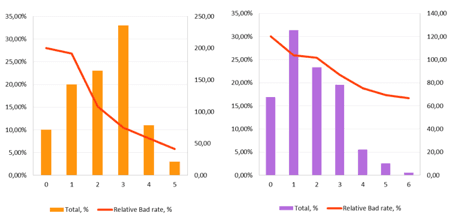
Chart 5: IDX5 distribution by population buckets and the relative bad rate indicatorWith the increase of the device quality index value, a significant decrease in the bad rate is ob-served. We advise using this variable for the lender’s integral score model of credit risk rate, as well as for setting a credit limit.
As can be seen from the given examples, the index variables have a high predictive power even when used individually. So IDX1 and IDX3 are applicable to fraud prevention, and IDX2, IDX4, and IDX5 — for credit risk rate integrated scoring model. When grouped right, their combination with frequency characteristics can further increase risk manage-ment efficiency and contribute to more accurate decision-making.
Our experience shows that only deep understanding of the physical meaning of each attribute, reasons of its value appearances, as well as the affecting factors and their correlation, can achieve a high statistical significance of the predictor. As a result, it can increase the attributes contribution to the resolving power of the conveyor and influence on business indicators of the organization.