
One of the fundamental principles which guide our working process is a constant search for useful and informative data, which help our clients and partners to achieve better results in credit and operational risks assessment. In fact, revealing and adding new features to our products not only allows to improve decision-making system, but also to ensure transparency and interpretability of results. That is why we pay so much attention to attributes architecture mechanics in our API vector response. Today we are eager to share the details about new user behaviour markers and device quality assessment principles as well as to demonstrate how JuicyScore data can significantly improve credit risk segmentation of the incoming flow.
IDX variable - what is it?
One of the main approaches implemented in JuicyScore products lies in aggregate IDX variables. Their essential part is a combination of rare events and factors related to them, collected by means of Deep Machine Learning algorithms to one variable, which may be used either for modeling or for integration to financial institutions decision-making system. Today we are going to review two independent variables of our data vector, paying great attention to their mechanics as well as to the factors they are based upon.
IDX2 - User behaviour markers
This aggregated variable is a combination of various user behaviour markers on online business web resource. In JuicyScore vector there are dozens of markers which are in some way related to user behaviour and the main issue in terms of variable construction is to find such stable markers, which would allow, aggregated in one, to identify high risk segments regardless of online business operating geography.
Variable IDX2 is based on the factors related to various user behavior or device utilization categories. On the one hand, it incorporates many factors connected with frequency characteristics. For example, the number of applications or requests for financial product obtaining from one user or the same device with a certain time periodization or without it over the entire history. On the other hand, there are also such parameters included into this variable, which identify stability or, on the contrary, data variability used in a credit application. A wide variety of such data on the same device or related to one virtual user indicates a high operational risk. At the same time high frequency of applications without data manipulation may indicate a higher credit risk (the so-called credit shopping, when a borrower applies for multiple credits to many financial institutions within a short period of time). The presence of both - high frequency and high variability of data on the same device or virtual user - is a strong sign of high operational risk.
Moreover, this variable also includes a number of factors regarded as high risk markers of user behaviour, which are not related to those two categories. For example, the way of form application filling, device utilization etc. Basically, we can see the combination of rare events of medium and high risk, which, integrated together in a certain way, may be used in a decision-making system and models, constructed by means of classical Gaussian methods.
As a result we have a variable, which has integer values from 1 to 6 and allows to build credit risk segmentation of the incoming flow and has stable zones to be used in models or stop factors. For example, the interval between 1 and 2 may be regarded as a low risk zone, which is often better in terms of risk level than the average. Within this segment we can further look for additional segments to be approved. Intervals between 5 and 6 are high risk zones. Usually they are comparatively small and may be used as filters or rules for application rejection. You can see relative risk level graph presented below.
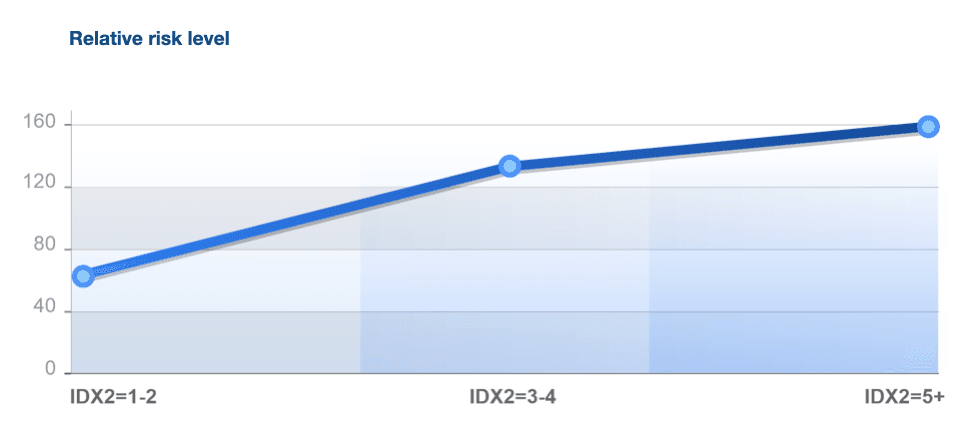
As we can see from the graph, variability indicator 1-2 stands for low risk, 3-4 - medium risk, when additional verification/validation should be carried out, indicator 5 stands for high risk level and in such cases we recommend to reject such applications.
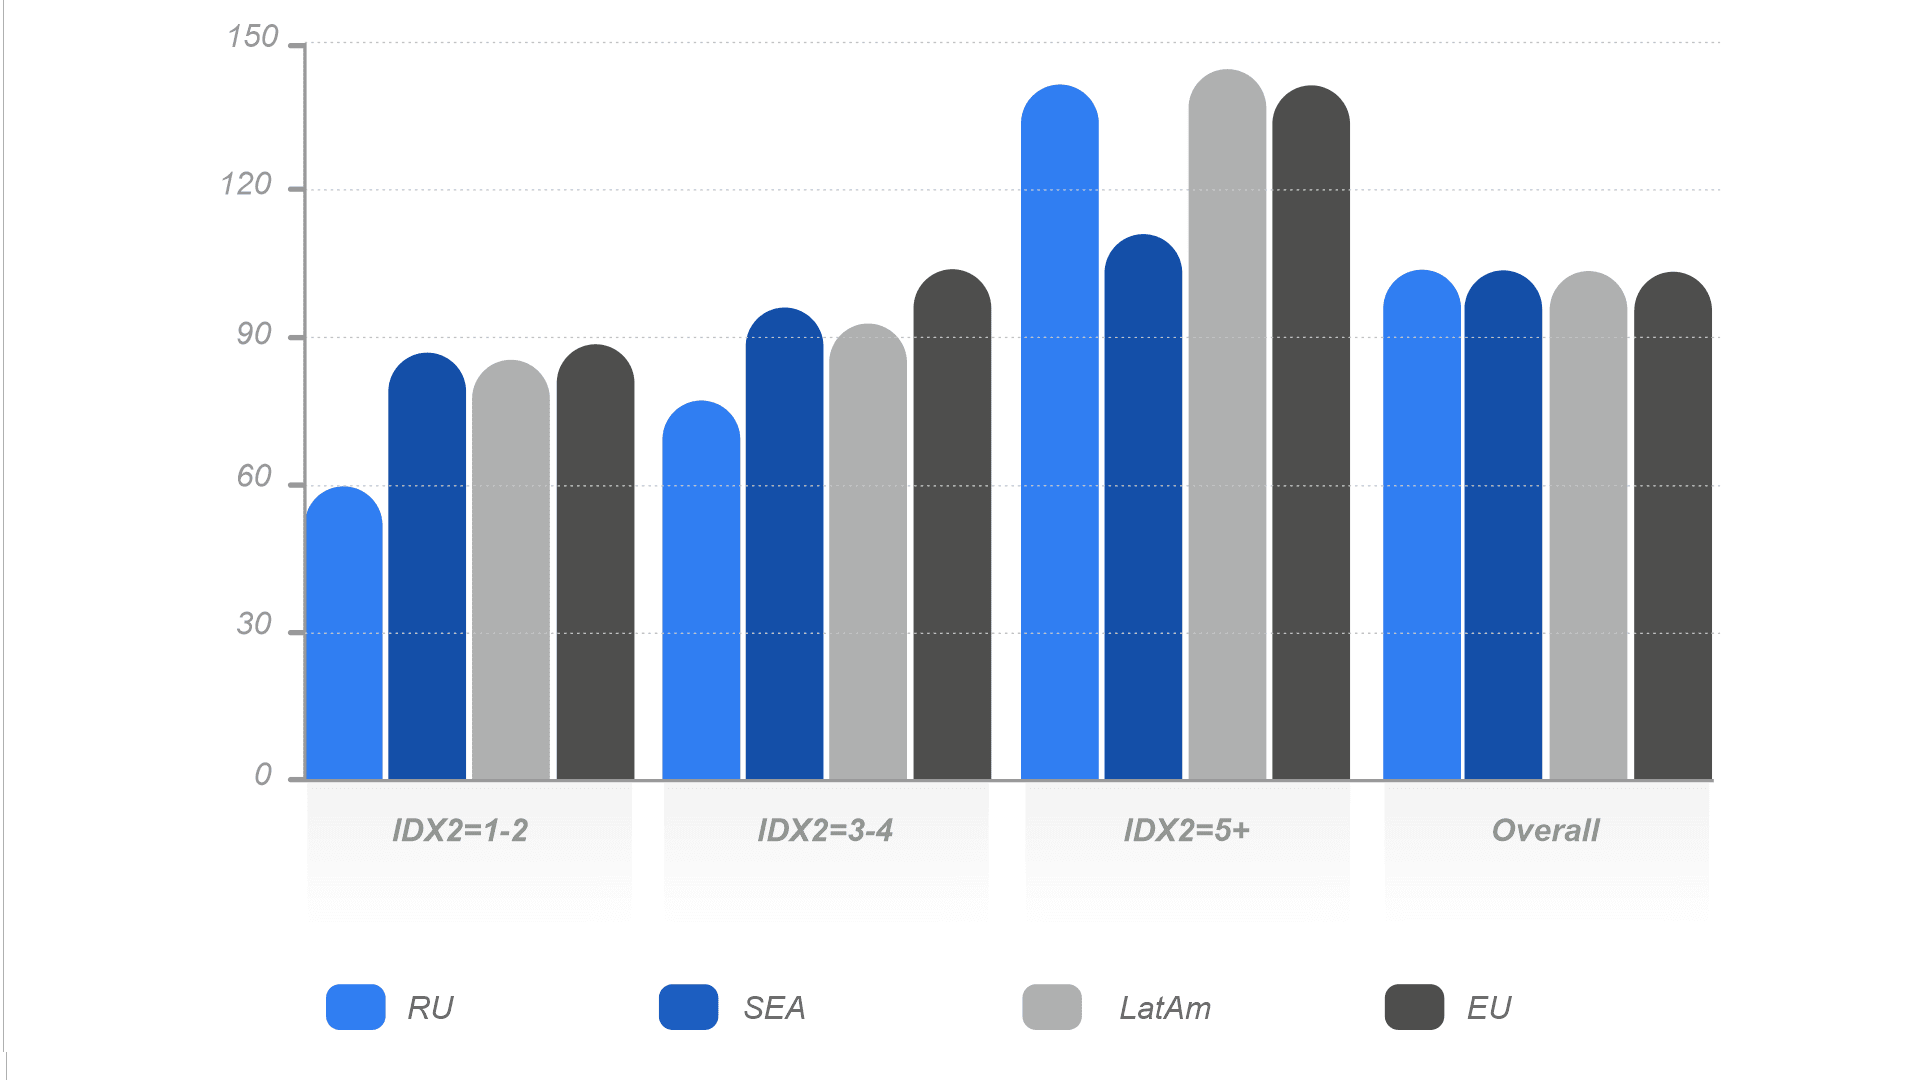
IDX2 values distribution by the region
IDX5 - Device quality index
Speaking about the operational risk assessing, the prior task is to reject applications of users with high risk of a loan defaulting and non-payment risk, while the main objective of credit risk assessment is to find those segments of users, which can be provided with financial products with the right and accurate parameters. Aggregate variable IDX5 falls into the second category. Using this variable financial institutions are able to improve credit risk segmentation of the incoming flow significantly. It is particularly important when there is a great lack of strong data institutions or quality of the data provided by them is rather low.
What approach is used to construct this variable?
Device quality function is the level of its cost, which is affected by the following data categories: device category (desktop or mobile), its technical metrics aggregate (storage capacity, number of cores, storage quality etc.) and device manufacturer (famous brand of the device or a no-name). It is important to note that devices with certain technical characteristics anomalies are not included into this index in order to convey a higher orthogonality level with the other aggregate variables IDX.
Every device has a big range of technical metrics and parameters, which affect on its quality and may be used also in order to assess credit risk. That is why developing this index it was highly important to identify such metrics and model factors in order to ensure the stability of value range of every factor, keeping in mind that we also need to provide the stability of value range of the index itself and to enhance its sharing ability. Speaking about stability it is also important to note that it should be ensured in time and also among all the geographies of our clients’ businesses.
Within the frames of Device Quality Index value interpretation, the part of the flow with low values of this Index identifies a segment with high credit risk and low level of disposable income. The part of the flow with high values of this Index makes it possible to identify segments with a low level of credit risk.
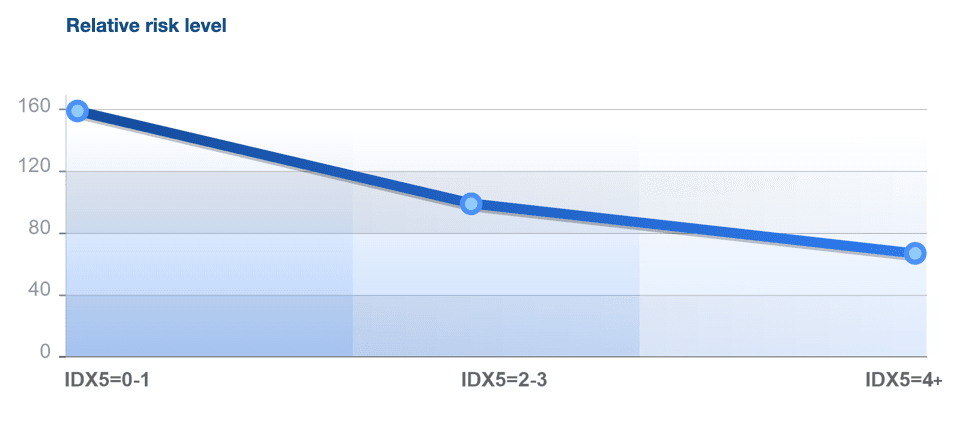
As we can see from the graph, variability indicator 0-1 stands for high credit risk, when additional verification/validation should be carried out or rejection required. Index indicator above 4 stands for low credit risk level, which means that it’s possible to find applications for additional approvals in this segment.
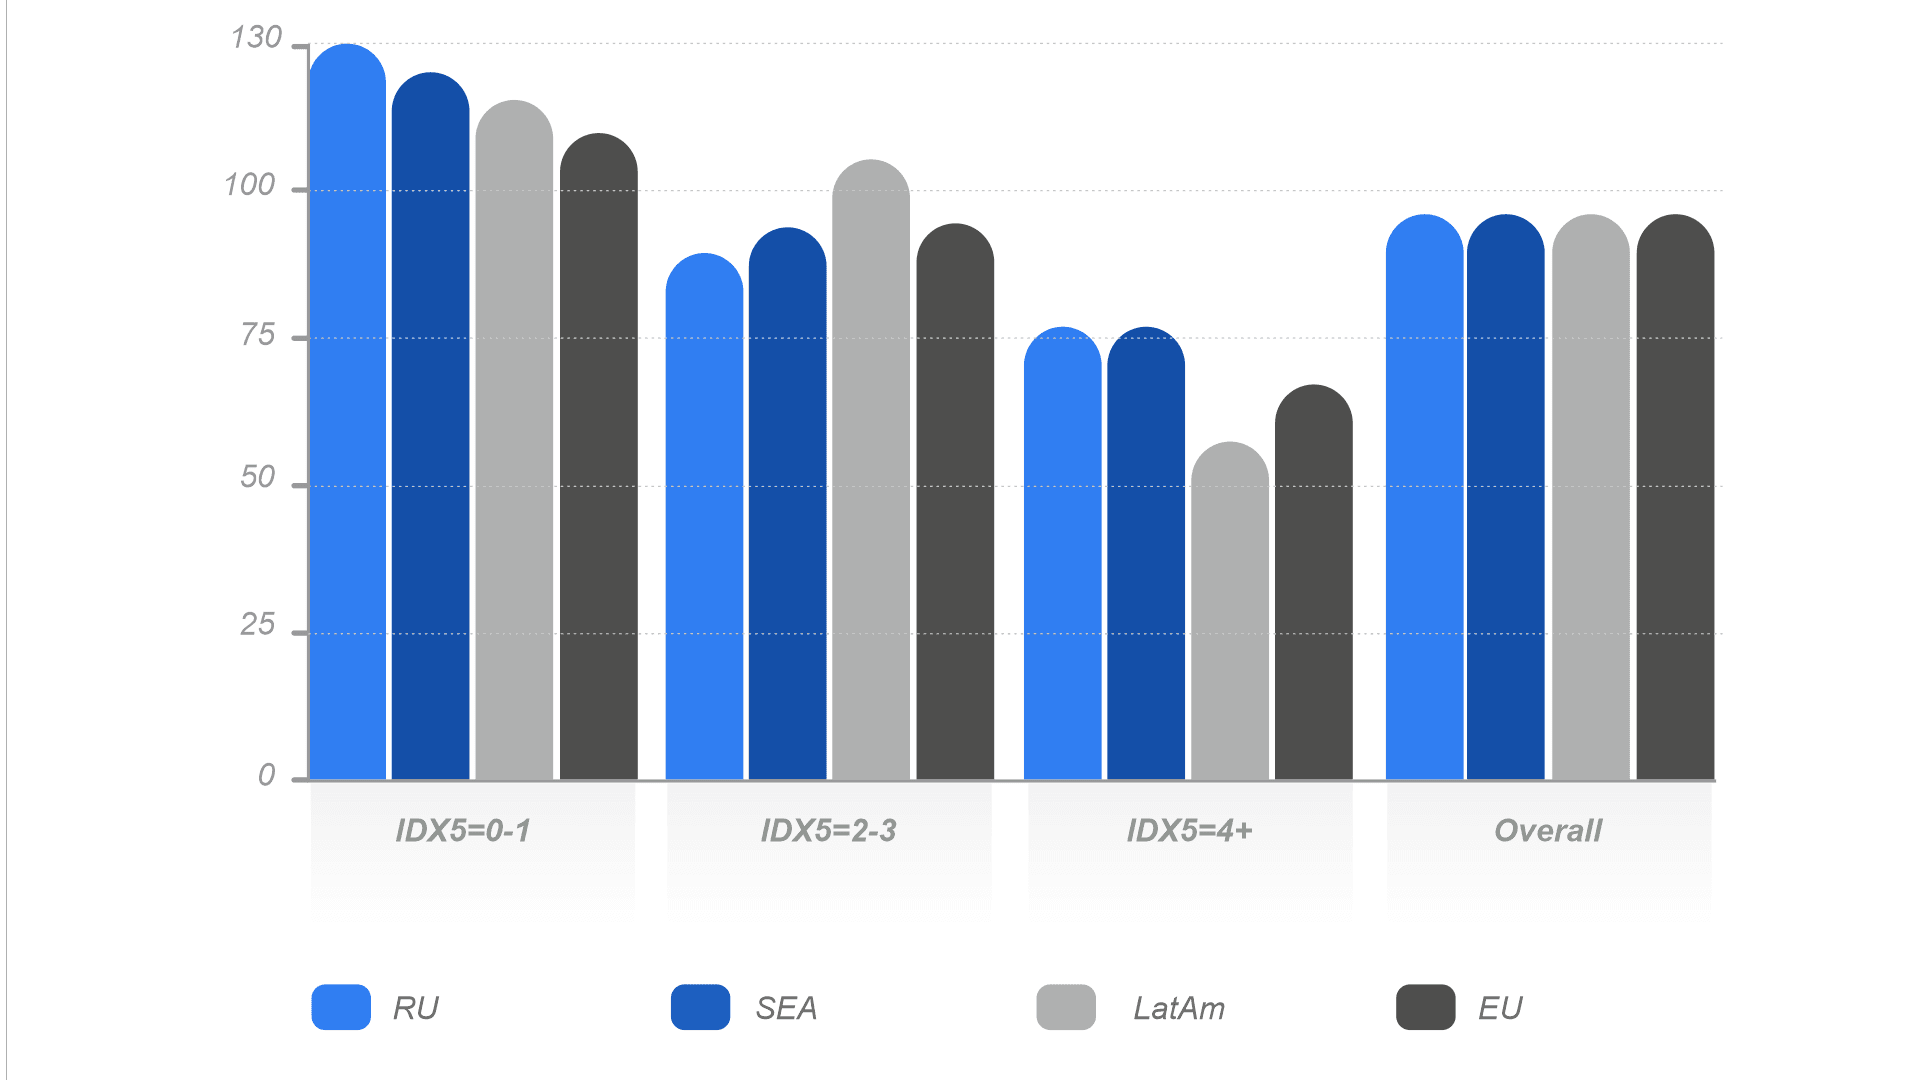
IDX5 values distribution by the region
This parameter is especially valuable for countries in South-East Asia and Africa regions in case there is a lack of reliable and regulated data sources.
The definitive and undoubted advantage of using index variables is universal applicability. They can be incorporated into the rules and filters or use separately as a component of operational or credit risk assessment model in order to identify most risky or, on the contrary, low risky segments. Basically, every index is a self-sustained model. The markers reviewed in this article are only a small part of the informative extension that we offer within the frames of our API.
JuicyTeam understands the importance of constant improvement and expanding the set of markers and stop factors which help to reduce costs and significantly reduce losses caused by fraud. We always provide our customers and partners with the best set of tools to cope with fraudulent applications.
Other related articles
We covered our approach to variables construction in other materials - Deep Machine Learning: on the path to the truth, where we reviewed some successful examples of methods which can be applied to solve practical problems to prevent fraud risk. Also we provided detailed information about IDX1 - a combination of stop factors and IDX3 - a combination of secondary risk markers and device anomalies, designed according to similar mechanisms, but aimed at slightly different range of issues, in our material Device analysis true value - JuicyScore secret methodology.