
The information is an extremely valuable resource in the 21st century. The amount of information on the Internet increases each year and various methods are used to process these data arrays. Today we will focus on three concepts: artificial intelligence (AI), machine learning (ML) and deep machine learning (DML). There are still a huge number of methods that are used by data analysis specialists and experts, and the purpose of this article is not only to explain the features of these concepts, but also to show successful examples how some methods can be applied to solve practical problems to prevent fraud risk.
The concept of Machine Learning
Machine learning (ML) is one of fundamental areas of artificial intelligence, the idea of which is to find a pattern in the available data, and then to spread it to new objects. In other words, it is a certain set or sample of values, which used to “train” the algorithm, in order to further apply for solving various types of problems, for example, forecasting and classification.
What is Deep Machine Learnig?
Deep Machine Learning (DML) is a subtype of machine learning. Its main feature is the use of machine learning methods and neural networks to solve real problems similar to human ones. DML searches for deep intermediate relationships between factors. Each element of the found dependence should be checked for stability and could be used to solve the problem of the next level - a particular hierarchy of attributes that were obtained by one or another statistical algorithm is built in the system, and each new layer has data about the previous one. From a practical point of view, to solve the top-level problem, an ensemble of models is used, each of which solves one of the problems below in the hierarchy. For example, the task of recognizing a human face might be a combination of several tasks: determining the points of the face contour, determining the individual parts of the face, as well as the layout of the found face elements within a previously defined contour. Other related business tasks may include fraud / spam detection; speech / handwriting recognition; translation and imitation of many other human cognitive functions.
The concept of Anomalies
The third concept that needs to be clarified before is rare event or the so-called “anomaly”. The basic character of a rare event is not only that it has a low frequency of occurrence, which follows from the name, but also the fact that the occurrence of such an event is usually accompanied by significant consequences, both are positive and sometimes negative. The example of this event is a natural disaster of great destructive power. In the field of finance industry, this could be a case, when an event leads to a high risk of loan default or loss on insurance contract.
On the one hand, it is important for companies to be able to predict the occurrence of such events and use them in their models in order to avoid the subsequent risk. On the other hand, since rare events do not follow the normal distribution law (which by definition requires a representative sample of target events), modelling of such events is seriously complicated.
For example, if we design a linear regression on a sample of 500 observations, where only 5 target events are represented (i.e. 1% of the sample), the result is an equation where the coefficient for an independent variable will receive the first significant digit only in the fourth or fifth digit after decimal point, which makes such a model completely inapplicable in practice.
How to improve your models?
Being one of risk assessment and fraud prevention solutions, JuicyScore uses deep machine learning algorithms to develop variables. Examples of such variables are Index variables (or variables of the IDX type in our standard data vector), which, on the one hand, extract useful information value from the factors underlying these Indexes, and, on the other hand, make it possible to level out data collection related issues and the insufficiency of useful values of each of these factors. Indexes allow using the synergy of many such factors that can be used as separate variables, reflecting the anomalies of one aspect of the Internet connection, for further research.
How we achieve high information value of the Indexes
- Building the certain combination of rare events, each of which occurs a small number of times and is insignificant from the point of view of classical Gaussian statistics, we manage to achieve the significance and statistical strength of the combination of such events;
- The variables included in the indices necessarily have a similar nature and transparent mechanics of formation, which allows, firstly, to achieve their stability, and, secondly, to reduce the cross-correlation of different Indexes.
Index variables as an example of the practical application of machine learning algorithms
We will clarify how we use machine learning methods using one of these variables from our classic set of output attributes, namely IDX4 - Connection details. This index describes anomalies associated with an Internet connection, attempts to manipulate its various features and parameters. The risk inside this index grows with the value of the index.
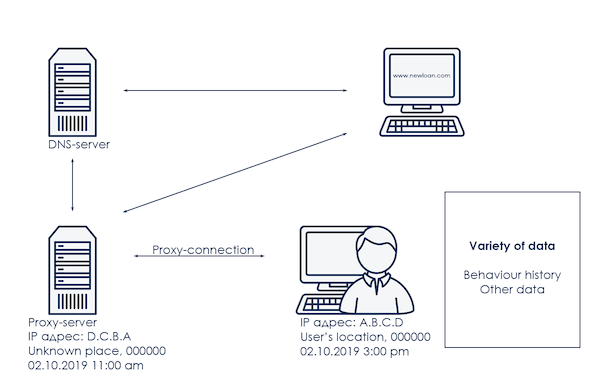
What is the nature of this index, and how exactly did machine learning methods help build dependent factors and prepare this variable? Let's start with a description of the subject area, which is schematically represented in the picture below:
There is a device with which the user accesses the Internet. The device has an IP address, date and time of access to the network, geographical coordinates and a mailing address, a data set describing user behavior, and a large amount of other information. The device is accessing a certain web resource, for example, the site of a financial institution, which means that you need to obtain the IP address of this site, for example, find the nearest DNS server. The signal to the DNS server may not go directly, but for example, through one or more intermediate and / or proxy servers. Both the DNS server and proxy servers also have their own attributes, such as a time zone, geographical coordinates and another data set.
Each component of the subject area shown in the picture can be detailed and described with its own set of attributes, parameters, and the main task is not only to identify the mechanics of occurrence and features, but also to define the predictive power and degree of influence on the simulated event. For example, the probability of write-offs on a loan. For a deeper understanding, we will consider several parameters from the described subject area.
IP address is a unique identifier for a node located on the network. In this article we will keep in mind classical IPv4 - we have already considered the risks and possibilities of IPv6 earlier and we still have to study the possibilities and anomalies of this type of IP-addresses.
One of the most common anomalies associated with an IP address is the mismatch between device and IP-address time zones. Why we call it common? Because, firstly, in a number of regions of our planet this situation is usual and may br treated as normal. Secondly, time zones may not coincide for objective reasons, for example, when synchronizing the device time zones and IP address time zone after a flight on a plane as this process can take up to a day. Thirdly, such discrepancy is a risk factor.
Time zone mismatch can occur from 0.1% of cases when this is an anomaly, and up to 15-20%, in those regions where this may be common. In any case, the presence of this factor almost always indicates a risk that needs to be taken into account and to be added as one of the factors to the risk engine, depending on the risk appetite.
The other common feature of the Internet connection is the presence of a proxy-connection, when for one or another reason, the virtual user hides his location or uses a non-transparent Internet infrastructure. Such events occurs from 1% in the Russian Federation to tens of percent in the countries of South-East Asia. In cases where there is not too many of such events, this most often indicates the user's deliberate actions to hide their activities from the owner of the web resource either lender or other financial institution. Otherwise, when a number of such cases is significant, the user often does not even know how exactly he goes to the Internet and how the network connection is built. From a practical point of view, the first group of cases is the most interesting, since it indicates the presence of a small or medium risk, if this is the only anomaly, and the presence of a high risk, if this anomaly is amplified by a number of other factors.
The third example, which in some cases might be considered a connection anomaly, are the DNS server settings. DNS is used to resolve all common web resource names like www.juicyscore.com into IP addresses. Most often, a host accesses the nearest DNS server or servers located to it, until a server is found that has information about which IP address corresponds to the entered web resource name. But it often happens that the closest DNS service for some reason is not quite the closest and can be separated from the actual IP address of the device by state borders and a certain number of time zones and hundreds of kilometers. Depending on the country, the proportion of such events is also quite small, usually no more than 3-5%, but in cases where this anomaly appears, it indicates moderate or even high level of risk, especially when accompanied by other anomalies.
What do the three examples have in common?
- all of them relate to different characteristics of an Internet connection and they are united by common mechanics and the same subject area.
- all of them are rare events - in most of the cases, the share of each of them in the applications inflow for the financial institution’s web resource is lower or significantly lower than 5%; this usually means that such events are difficult in use or modelling and Classical Gaussian statistics (e.g. linear or logistic regression) based methods are not applicable to them;
- all of them significantly affect the risk of fraud, as they are often associated with forced and deliberate actions of the device user, and do not happen by accident.
On the one hand, these factors are extremely important due to their nature, and on the other hand, it is difficult to use such factors for credit engine rules and settings automation. Now imagine that there are not three such factors, but five, ten, or even several dozen. And each of them is a rare event with a large risk component inside. What to do in this case?
In this case machine learning methods such as both classical interpreted methods (for example, decision trees or logistic regression), and uninterpreted methods can be used. We are at JuicyScore prefer using interpreted methods, because, firstly, in our opinion, they are more applicable to forecasting financial risks, and secondly, they are more resistant to the peculiarities of the data themselves that are used for modelling.
Applying deep machine learning approaches
- We have obtained a number of stable factors that describe individual parameters of the Internet connection.
- Each of these factors is independent and can be used separately.
- The combination of factors allows us to solve the problem of a higher level of the hierarchy - determining the risk of fraud in the flow of credit applications.
As a result, when using combinations of the methods stated above, a variable is obtained that has a distribution of this kind.
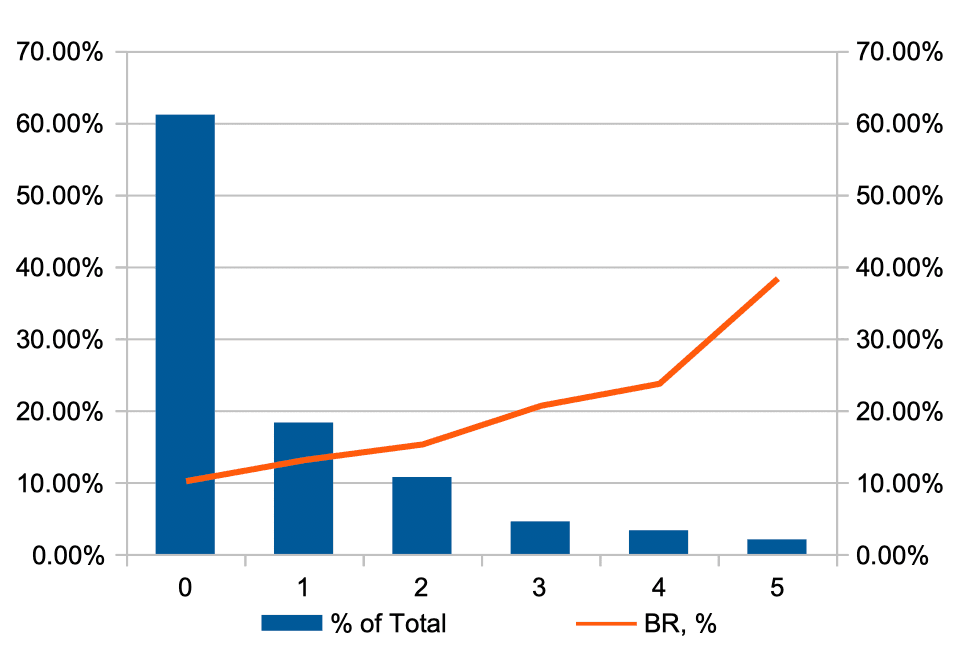
The blue histogram in the graph shows the distribution of the proportion of observations by the values of the IDX variable, and the red line shows the relative risk level (BR, or bad rate) in each cohort.
As can be seen from the graph, using machine learning methods, it is possible
- to make significant cohorts in terms of the number of observations in each and a share of the total number;
- to achieve monotonous distribution of the target variable level - in this case, the FPD level;
- to use the variable for rare events risk modelling, and for credit risks modelling, which are continuous, rather than discrete.
And here is how the distribution of the index values looks like depending on the applicant country.
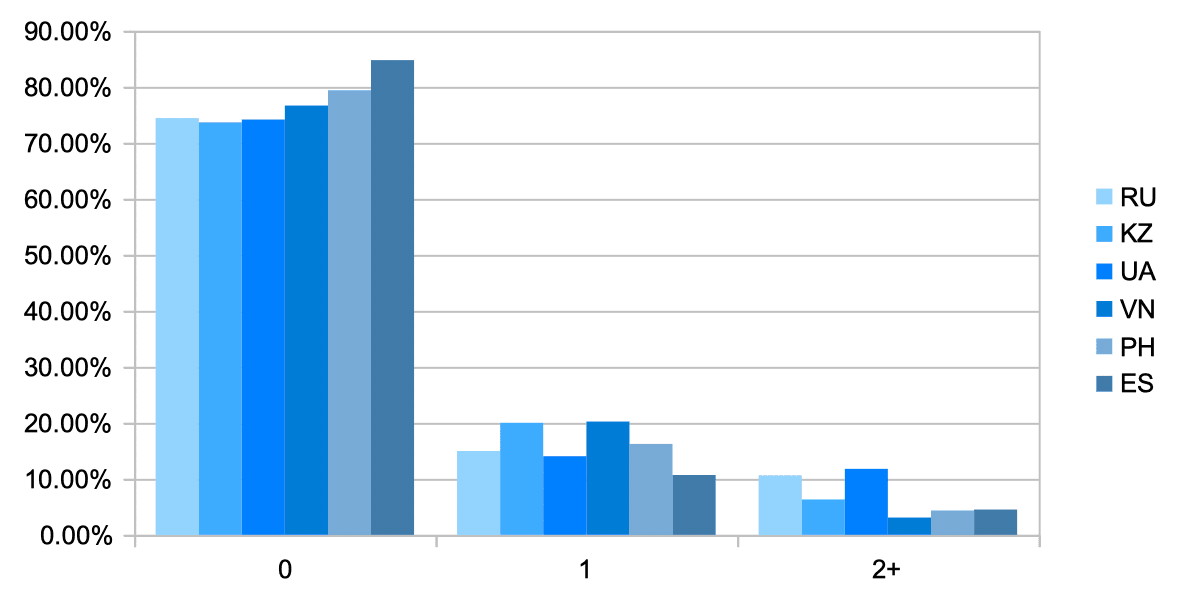
The graph shows that the proportion of observations where there are minor (cohort 1) and significant (cohort 2+) Internet connection anomalies is highly dependent on the region. It is not surprising that in Vietnam, where due to Internet infrastructure features and the lack of IPv4 addresses, the share of these cohorts is higher than in Spain, where there are much fewer such events, and the lack of IPv4 addresses is not felt on such a scale. What these two countries have in common: the presence of anomalies complicates the analysis of the device and, subsequently the analysis of the applicant, and therefore it increases the probability of risk.
Some closing thoughts on Machine Learning methods
Machine learning methods are a powerful tool. When the nature of the data is clear the correct modelling methods may be applied to solve problems, such as various kinds of risk forecasting:
- to identify dependencies which are not clear and obvious;
- to allow them to be brought to a form that makes them suitable for use in various kinds of models embedded in the credit engine or in actuarial calculations;
- to allow achieving stability of distribution over time and interpretability of the results.
Since any subject area is a complicated system that can be described by an infinite number of factors, parameters, metrics and attributes, the process of new useful factors and features extracting is a non-stopping exercise, and the number of indexes obtained in practice is infinitely large, which means that there is the opportunity to keep adding the information value to of our service.